In this article, Transmission Line Energization Study is demonstrated using Power Systems Computer Aided Design (PSCAD) software.
This study illustrates the key points considered in a line energizing study. The PSCAD ‘Multiple-Run’ component is used to time the instant at which the three poles of the circuit breakers are closed.
This study considers energizing the line when it is fully de-energized. However, the worst case is more likely when the line is energized (re-energized), when there is ‘trapped charge’ on the line. The re-energization of the line is not covered in this article.
System Overview
Below figure shows a typical high voltage ac network consisting of 400 kV and 115 kV transmission lines:
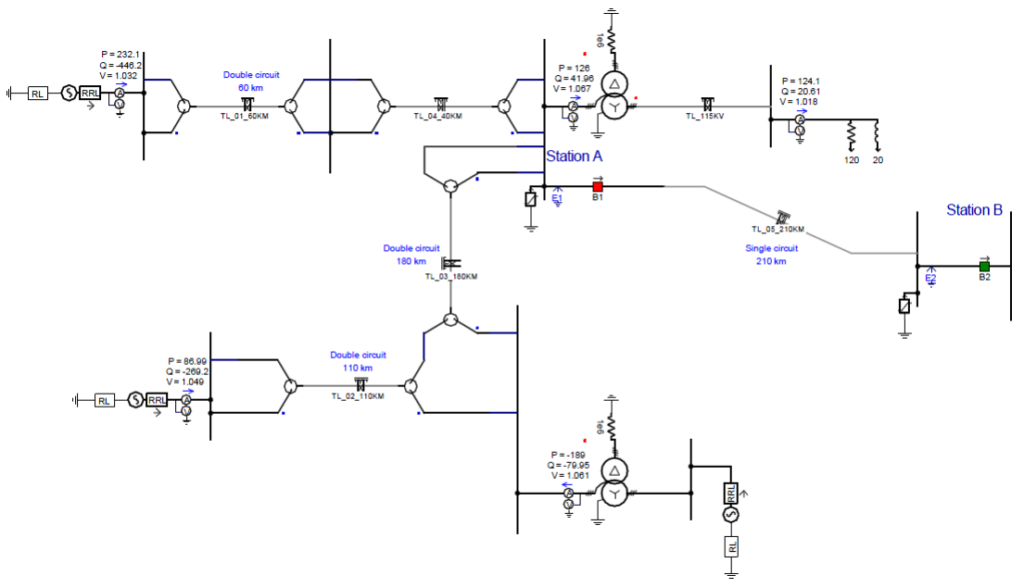
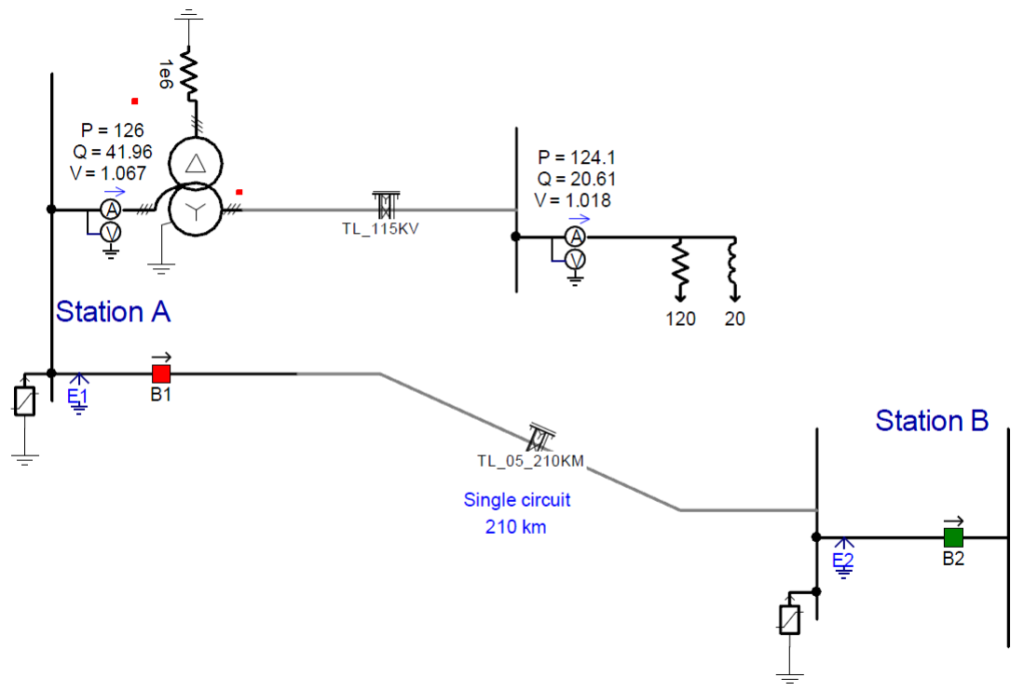
The 210 km single circuit line (400 kV) between Station A and Station B is the focus of the line energizing study. The line is energized from Station A. The circuit breaker at Station B is open.
Thus, E2 is the open end voltage of the energized line as per below figure:
Important Features of Network Modelling
Important features of the network model are as follows:
- The network details up to two buses away from Station A.
- The rest of the system is represented by Thevenin’s equivalence voltage sources.
- Detailed ‘frequency dependent’ line models for transmission lines.
- The model includes surge arresters at Station A as well as the line end surge arrester at Station B
Network Equivalence
The parameters of the voltage source(s) representing the ‘remote’ buses must accurately represent the fault current contribution from the ‘remote’ system. As well, the voltage magnitude and the phase angle must correspond to the specific system operating condition (i.e. load flow condition).
As such, we proceed as follows:
- We enter the positive and zero sequence impedance of the ‘remote’ system calculated based on the fault levels.
- We enter the voltage source magnitude and phase angle corresponding to the system operating condition.
- Note that prior to performing the energizing study, the correct steady-state power flow in different parts of the network should be verified (i.e. conduct a comparison with known power flow conditions).
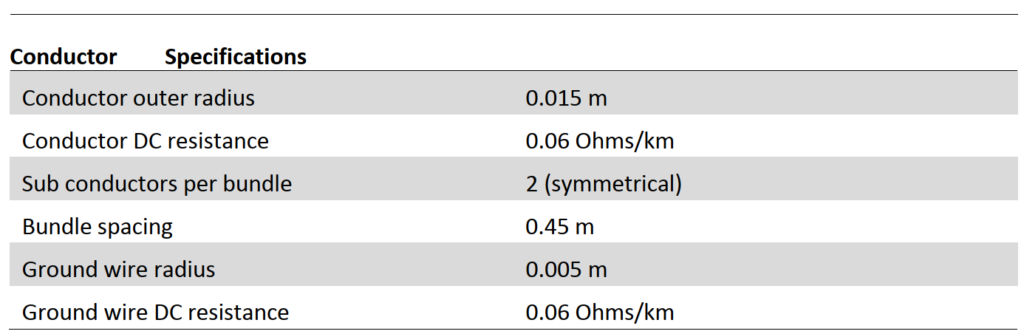
Transmission Line Data
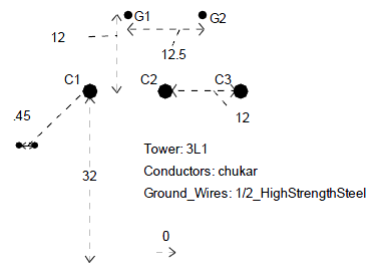
Below figure and table shows the typical data corresponding to a 400 kV line used in this example simulation:
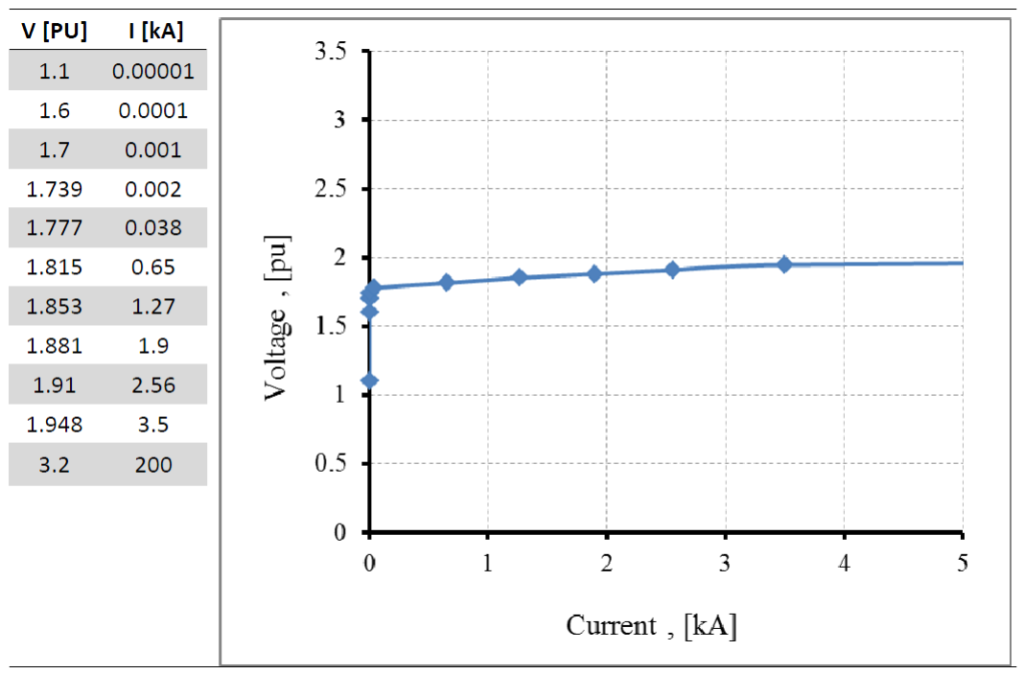
Surge Arrester Data
Below table shows the surge arrester characteristics used in this example. The rated voltage of the surge arresters (connected from line to ground) in this example is 335 kV. This is typical for a 400 kV system. The PU voltage (as per below table) is based on the surge arrester rated voltage. Slope of the V-I Characteristic curve must reduce as current increase.
Objectives of Line Energizing Study
The main objectives of a line energizing study are to demonstrate the following:
- The peak switching overvoltage is less than the ratings of the substation switching surge insulation levels.
- The energy dissipation in the surge arrester during the switching surge is within the surge arrester energy rating.
Simulation Results
In this study, the multiple-run component of PSCAD is used to energize the line at different points on the voltage waveform. All three breaker poles close at the same instant. Thus, this example does not cover the pre-strike phenomenon of an individual breaker pole.
The multiple-run unit is set up to repeat the simulation 106 times. On each run, the breaker B1 closes at a different point on the voltage waveform.
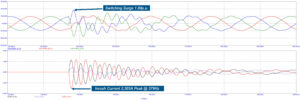
The simulation results shown in below figure are for the worst case, in which the line end voltage (E2) attains its largest peak value (approximately 600 kV or 1.85 PU).
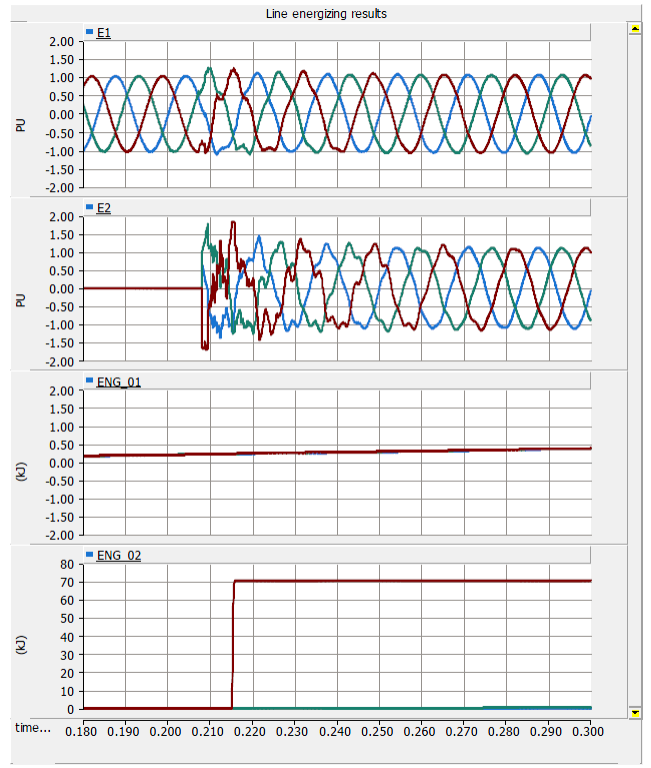
Note that the surge arrester energy dissipation is around 70 kJ. These values must be compared with relevant equipment ratings.
Note that the transients at Station A bus are less severe than at the remote end of the line.
Below table shows the statistical summary of the line energizing results (i.e. multiple runs):
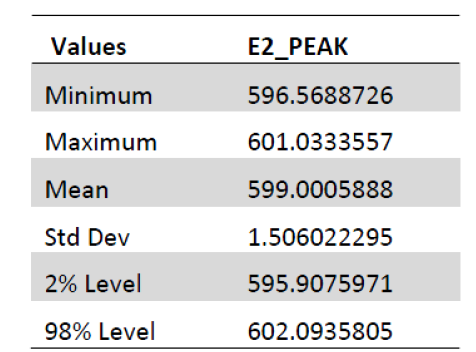
The description of the values displayed in above table are as follows:
- Minimum and Maximum: These are minimum and maximum values observed in the study sample (i.e. peak overvoltage – raw data).
- Mean and Std. Dev.: These are the mean value and the standard deviation of the data sample.
- 2% level: Statistically, 2% of line switching events will results in peak over- voltage levels less than this value.
- 98% level: Statistically, 98% of line switching events will results in peak over- voltage levels less than this value.
Hints
The following are some helpful hints for during the study:
- Use the ‘Snapshot’ feature to speed up the multiple-run simulations.
- Disable graphic animations during multiple runs to speed up the simulation.
2 Responses
Hello
Hello, Hope you are doing well and enjoying the articles